Edit chart
Loading graph
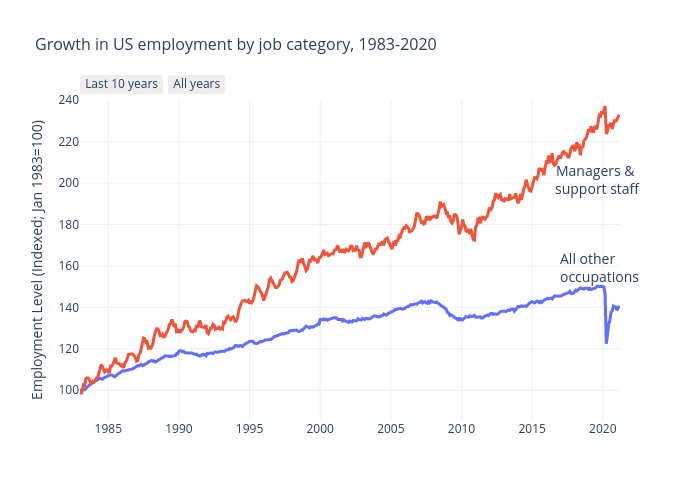
Michelezanini's interactive graph and data of "Growth in US employment by job category, 1983-2020" is a line chart, showing All other occupations vs Mgrs. & admins; with in the x-axis and Employment Level (Indexed; Jan 1983=100) in the y-axis.. The x-axis shows values from 1983-01-01 to 2021-03-21 00:23:36.7235. The y-axis shows values from 85.63760588429663 to 240.13504987318552. This visualization has the following annotations: Managers & support staff; All other occupations